Information Panel
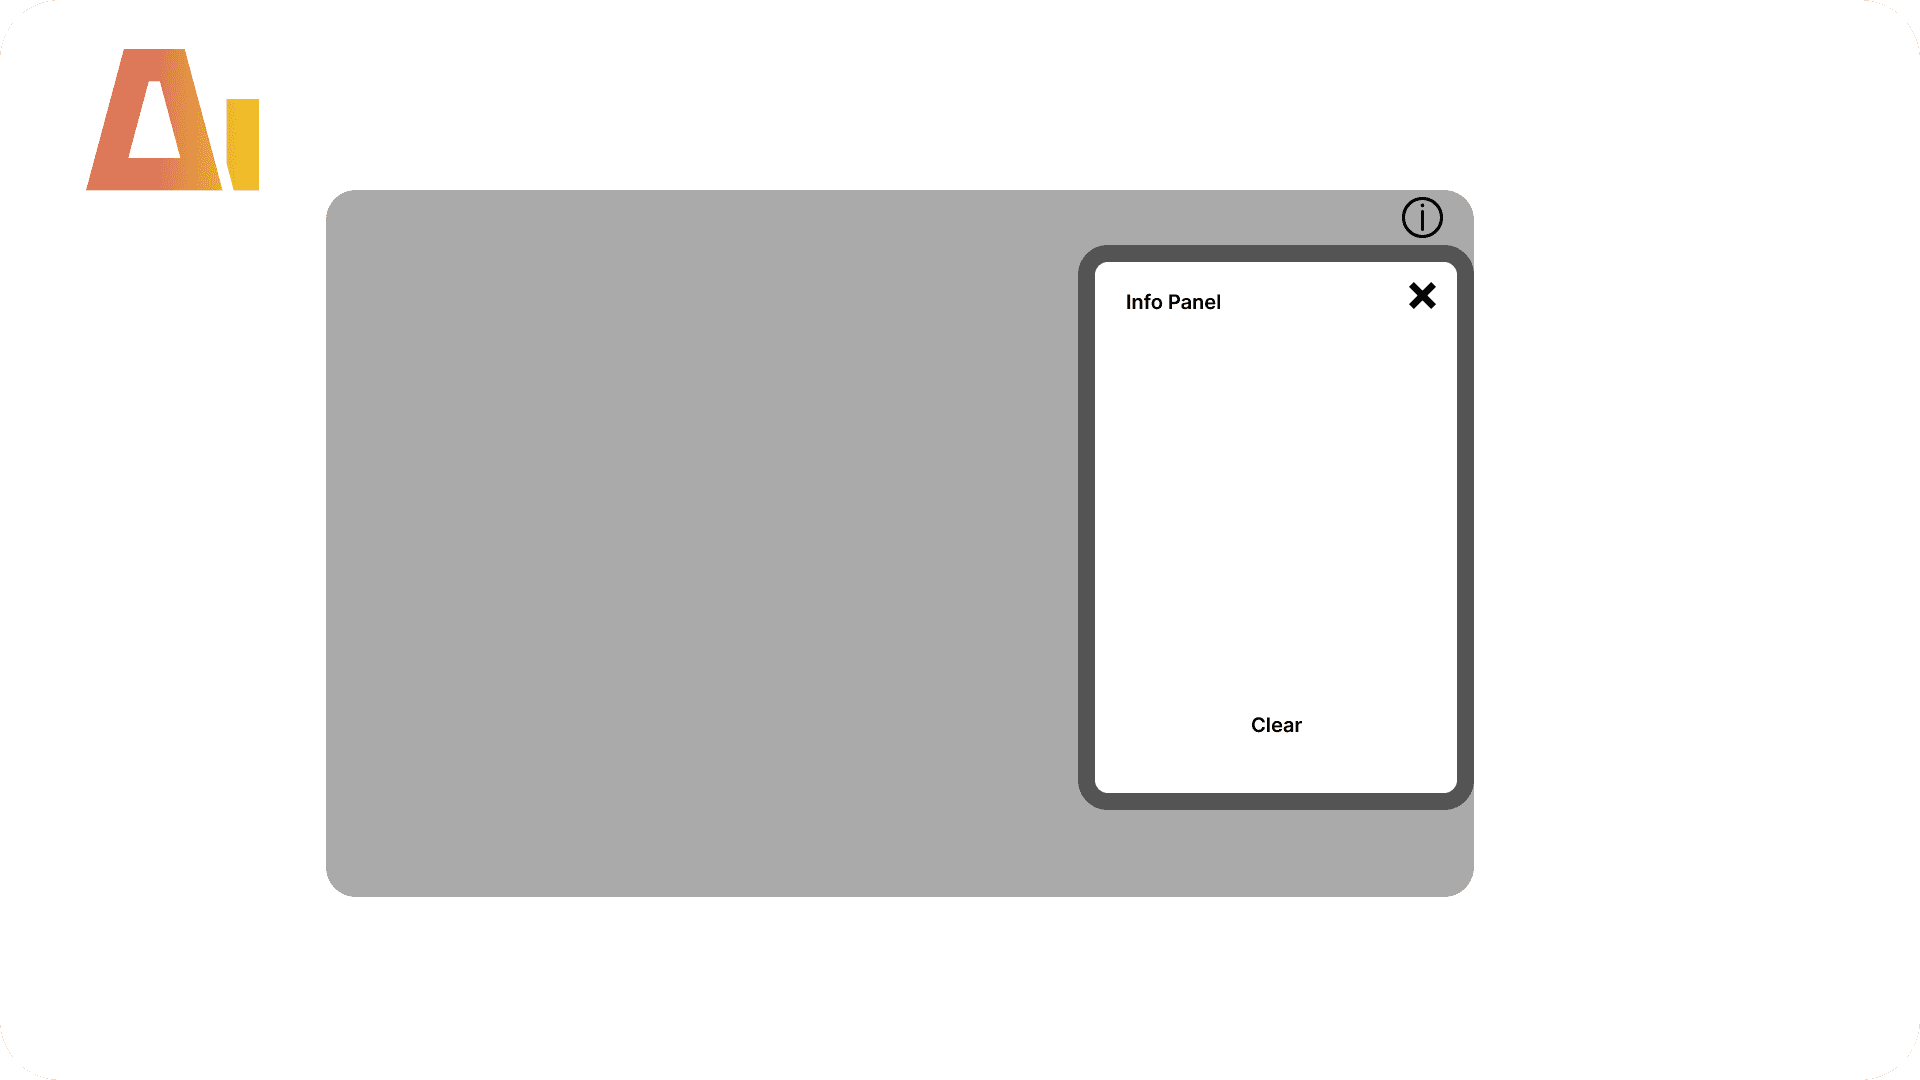
Static Information Overlay
Build
Build
Overview
Features
Prompts
Help
Key Features
Most reports need a little explaining: what a metric means, where the numbers come from, how to use the page. The tidy way to add that is a panel readers can open when they want it and close when they're done — but building one by hand in Power BI Desktop is fiddly. You're stacking a group container, a background shape, a textbox, icon buttons, and two bookmarks, then lining up the panel's coordinates, wiring the bookmark IDs, and getting the layering right across a pile of JSON files. This skill builds the whole thing in one command — the button, the panel, the title and text box, the icons, and the show/hide bookmarks — so all that's left for you is to type in your wording — run it with /info-panel.
How it works
Type /info-panel, provide the page ID, and the skill builds everything:
Locates the report definition folder and confirms the page directory exists
Inherits the label font from any existing textbox on the page (falls back to theme defaults if none)
Creates a group container covering the panel bounds, positioned right-aligned by default
Creates a white rounded background rectangle inside the group
Creates a close icon button (top-right of panel) and title textbox (left of close button)
Creates a content textbox filling the panel body with placeholder text
Creates an info icon button on the main page layer (always visible, outside the group)
Registers 4 SVG icons in the static resources and wires them to buttons
Creates two bookmarks: ShowInfoPanel (makes all panel visuals visible) and HideInfoPanel (makes all panel visuals hidden), both registered in bookmarks.json
What you get
Group container — wraps all panel visuals into a single layer; hidden by default
Background rectangle — white rounded rectangle filling the panel bounds
Title textbox — bold label at the top of the panel
Content textbox — editable body area with placeholder text
Close button — icon button at the top-right of the panel; fires HideInfoPanel bookmark
Info button — icon button on the main page (always visible); fires ShowInfoPanel bookmark
ShowInfoPanel bookmark — wired to the info button; makes the group and all child visuals visible
HideInfoPanel bookmark — wired to the close button; makes the group and all child visuals hidden
4 registered SVG icons — info and close in default and hover states
All panel visuals start hidden (on the group container only). The info button is always visible on the main page layer.
Panel layout
┌──────────────────────────────┐
│ Information Panel       [x]
Panel defaults to right-aligned at the edge of the page
Default size: 320 x 400 px (configurable)
Overview
Features
Prompts
Help
Key Features
Most reports need a little explaining: what a metric means, where the numbers come from, how to use the page. The tidy way to add that is a panel readers can open when they want it and close when they're done — but building one by hand in Power BI Desktop is fiddly. You're stacking a group container, a background shape, a textbox, icon buttons, and two bookmarks, then lining up the panel's coordinates, wiring the bookmark IDs, and getting the layering right across a pile of JSON files. This skill builds the whole thing in one command — the button, the panel, the title and text box, the icons, and the show/hide bookmarks — so all that's left for you is to type in your wording — run it with /info-panel.
How it works
Type /info-panel, provide the page ID, and the skill builds everything:
Locates the report definition folder and confirms the page directory exists
Inherits the label font from any existing textbox on the page (falls back to theme defaults if none)
Creates a group container covering the panel bounds, positioned right-aligned by default
Creates a white rounded background rectangle inside the group
Creates a close icon button (top-right of panel) and title textbox (left of close button)
Creates a content textbox filling the panel body with placeholder text
Creates an info icon button on the main page layer (always visible, outside the group)
Registers 4 SVG icons in the static resources and wires them to buttons
Creates two bookmarks: ShowInfoPanel (makes all panel visuals visible) and HideInfoPanel (makes all panel visuals hidden), both registered in bookmarks.json
What you get
Group container — wraps all panel visuals into a single layer; hidden by default
Background rectangle — white rounded rectangle filling the panel bounds
Title textbox — bold label at the top of the panel
Content textbox — editable body area with placeholder text
Close button — icon button at the top-right of the panel; fires HideInfoPanel bookmark
Info button — icon button on the main page (always visible); fires ShowInfoPanel bookmark
ShowInfoPanel bookmark — wired to the info button; makes the group and all child visuals visible
HideInfoPanel bookmark — wired to the close button; makes the group and all child visuals hidden
4 registered SVG icons — info and close in default and hover states
All panel visuals start hidden (on the group container only). The info button is always visible on the main page layer.
Panel layout
┌──────────────────────────────┐
│ Information Panel       [x]
Panel defaults to right-aligned at the edge of the page
Default size: 320 x 400 px (configurable)
Overview
Features
Prompts
Help
Key Features
Most reports need a little explaining: what a metric means, where the numbers come from, how to use the page. The tidy way to add that is a panel readers can open when they want it and close when they're done — but building one by hand in Power BI Desktop is fiddly. You're stacking a group container, a background shape, a textbox, icon buttons, and two bookmarks, then lining up the panel's coordinates, wiring the bookmark IDs, and getting the layering right across a pile of JSON files. This skill builds the whole thing in one command — the button, the panel, the title and text box, the icons, and the show/hide bookmarks — so all that's left for you is to type in your wording — run it with /info-panel.
How it works
Type /info-panel, provide the page ID, and the skill builds everything:
Locates the report definition folder and confirms the page directory exists
Inherits the label font from any existing textbox on the page (falls back to theme defaults if none)
Creates a group container covering the panel bounds, positioned right-aligned by default
Creates a white rounded background rectangle inside the group
Creates a close icon button (top-right of panel) and title textbox (left of close button)
Creates a content textbox filling the panel body with placeholder text
Creates an info icon button on the main page layer (always visible, outside the group)
Registers 4 SVG icons in the static resources and wires them to buttons
Creates two bookmarks: ShowInfoPanel (makes all panel visuals visible) and HideInfoPanel (makes all panel visuals hidden), both registered in bookmarks.json
What you get
Group container — wraps all panel visuals into a single layer; hidden by default
Background rectangle — white rounded rectangle filling the panel bounds
Title textbox — bold label at the top of the panel
Content textbox — editable body area with placeholder text
Close button — icon button at the top-right of the panel; fires HideInfoPanel bookmark
Info button — icon button on the main page (always visible); fires ShowInfoPanel bookmark
ShowInfoPanel bookmark — wired to the info button; makes the group and all child visuals visible
HideInfoPanel bookmark — wired to the close button; makes the group and all child visuals hidden
4 registered SVG icons — info and close in default and hover states
All panel visuals start hidden (on the group container only). The info button is always visible on the main page layer.
Panel layout
┌──────────────────────────────┐
│ Information Panel       [x]
Panel defaults to right-aligned at the edge of the page
Default size: 320 x 400 px (configurable)
Explore more in this category
Absolute / Percentage Toggle
Build
Add a tile slicer to any chart that switches between absolute values and percentages

Active Filters Card Visual
Build
Generate a card visual that dynamically displays all currently active slicer and filter selections.

Apply rounded
Build
Convert standard column or bar charts to a lollipop "rounded column" style using Power BI's native error bar feature
Clone Page
Build
Clone any report page with all visuals and bookmarks
Tool Information
Skill
39 USD
Bundle (All skills)
249 USD
Category
Build
Version
Version 2.2.2.2
or log in if you already have an account